Most hosting benchmarks ask you to take a number on faith. This one does not. Below are 3,600 timed requests, the exact method that produced them, every confounding variable we know about, the tests we could not run, and an offer of the raw per-request data so you can check our arithmetic.
We rebuilt the server fleet behind our managed WordPress hosting this year. This is the measurement of what that actually bought, run on 21 August 2026 against our own hardware, old and new.
Opening the block editor took 56 ms on the new generation against 149 ms on the previous one, and wp-admin took 26 ms against 73 ms. Admin screens are rebuilt on every request, so no page cache gives that time back.
The new machines are far more predictable. On the homepage, the slowest 1 request in 100 lands just 1.7 ms above the median, compared with 51 ms on the previous generation. Almost every request is the typical request.
3,600 timed requests and 0 failed responses across identical WordPress installs measured directly on the machines. The full test battery was run twice, showing the apparatus was stable to within 0.6%.
This is not a processor comparison. The two machines also differ in memory, neighbour count, virtualisation, and database tuning. The full confounder table is published below rather than buried.
What we did not measure: concurrency, competitors, visitor-perceived load time, and CDN delivery. Every gap is stated along with the reason we could not close it.
Why we ran this
Every WordPress page starts as nothing. The theme loads, the plugins fire, the queries run, and only then does HTML exist. That work happens on a CPU and it is the one part of your site a cache cannot skip.
WordPress builds a page in a single process, so what you feel is how fast one core can work, not how many there are. That is the whole reason our new generation looks the way it does: we optimised for faster cores. It also clears up a confusion that costs people money, because adding PHP workers does not make one page render faster, it lets more pages render at the same time. We pulled that apart in PHP workers vs CPU cores.
The claim we wanted to test was narrow: does a site on our new-generation hardware spend less time building a page than the same site on the generation it replaced?
How we measured
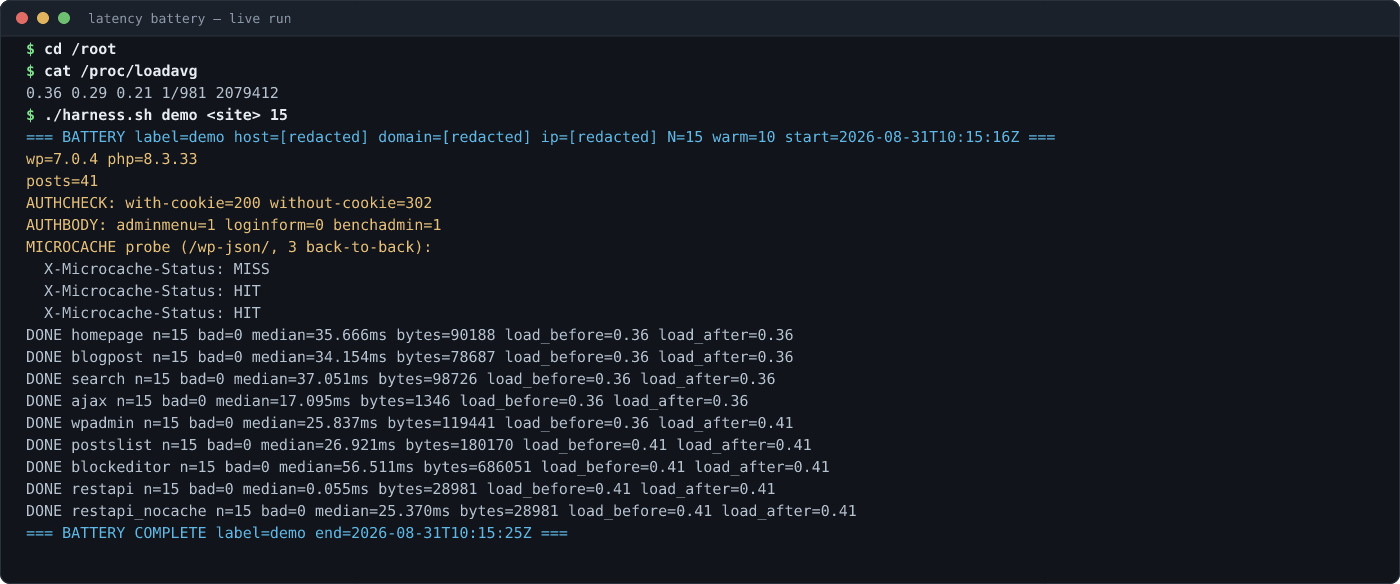
The metric is server think time: curl‘s time_starttransfer minus time_connect, which is the interval between the server accepting the request and the first byte of the response coming back. We measured on the machine itself, over HTTP to the box’s own address, through the real nginx to Apache to PHP-FPM path. No internet, no TLS handshake, no CDN in the way.
- 100 requests per task, per server, with 10 warm-up requests discarded before each task.
- The whole battery run twice on each server, to measure how much the apparatus itself drifts.
- Percentiles by linear interpolation between closest ranks.
- Load average captured immediately before and after every task, on both servers.
- Response sizes compared byte for byte between the two servers on every task, so we are never timing two different pages.
- 0 non-200 responses out of all 3,600 samples.
One methodological trap is worth describing because it very nearly spoiled the run. WordPress validates the auth cookie, not just the logged_in cookie, so an authenticated test built the obvious way silently benchmarks three login redirects instead of the admin screens. The harness now refuses to record a sample unless the request returns 200 with cookies, 302 without them, and the response body contains the admin menu and the test username and no login form. All four assertions run on both servers on every pass.
A run built that way would have silently benchmarked three login redirects.
InstaWP infrastructure team, benchmark report, 21 August 2026
The test site
The same site was built from scratch on both servers on the day of the test, from the same script.
| Component | Setting |
|---|---|
| WordPress | 7.0.4, identical on both |
| Theme | Twenty Twenty-Five |
| Plugins | None active. One 40-line must-use plugin registering the AJAX endpoint |
| Content | 41 posts with fixed titles, slugs, bodies, and dates |
| Permalinks | /%postname%/ |
| Caching | No page cache, no persistent object cache, WP-Cron disabled |
| PHP |
8.3 FPM, pm=ondemand, byte-identical pool configuration on both servers
|
| OPcache | 128 MB, JIT off, identical configuration on both servers |
Both sites answered on the same domain string, so response bodies are byte-comparable. They were: page sizes matched exactly on all nine tests.
The two servers
One new-generation machine and one previous-generation machine, both picked to be typical rather than flattering. The previous-generation box is the median box of its group by site count, chosen from seven candidates, not the busiest or the quietest. If the difference between a dedicated machine and a virtualised one is new to you, we unpacked it in cloud hosting vs VPS.
| Component | New generation | Previous generation |
|---|---|---|
| Machine | Dedicated physical server | Virtualised cloud instance |
| CPU | 8-core AMD Zen 5, 16 threads | 8 vCPU |
| CPU governor | performance |
Not exposed to the guest |
| Memory | 64 GB DDR5 | 16 GB |
| Storage | NVMe SSD in a ZFS mirror | ext4 on network block storage |
| Sites sharing the box | 14 | 736 |
| Load average at test time | 0.20 | 0.26 |
| PHP | 8.3.33 | 8.3.30 |
| MariaDB | 11.4.12 | 11.4.10 |
Results: server think time
Server think time by task, median of 100 requests
Time the server spends building the page, measured on the machine itself. Lower is better. Identical WordPress install, content and theme on both servers, with no plugins active.
Opening the block editor
Loading the homepage
Running a site search
Loading a blog post
Opening the posts list
Opening wp-admin
A REST API request
An AJAX request
n = 100 requests per task per server, 10 warm-up requests discarded before each. 0 non-200 responses across all 3,600 samples. Measured 21 August 2026. The REST API row bypasses our 5-second nginx microcache, for the reason explained in the methodology section.
The full distribution, not just the middle of it. IQR is the interquartile range, the spread of the middle half of requests. A small IQR means the server is predictable.
| Task | Server | Median (ms) | IQR (ms) | p95 (ms) | p99 (ms) |
|---|---|---|---|---|---|
| Opening the block editor | New gen | 56.28 | 2.73 | 58.81 | 73.60 |
| Previous gen | 148.81 | 5.88 | 174.26 | 200.83 | |
| Loading the homepage | New gen | 35.29 | 0.49 | 36.79 | 36.96 |
| Previous gen | 93.07 | 3.31 | 122.30 | 144.22 | |
| Running a site search | New gen | 36.88 | 0.31 | 38.46 | 38.49 |
| Previous gen | 97.66 | 2.35 | 102.44 | 106.61 | |
| Loading a blog post | New gen | 34.30 | 1.83 | 36.09 | 36.30 |
| Previous gen | 90.21 | 2.14 | 95.08 | 104.83 | |
| Opening the posts list | New gen | 26.69 | 0.49 | 27.96 | 28.64 |
| Previous gen | 73.57 | 5.37 | 97.60 | 112.66 | |
| Opening wp-admin | New gen | 25.77 | 0.89 | 26.64 | 26.78 |
| Previous gen | 72.83 | 7.37 | 86.70 | 92.58 | |
| A REST API request | New gen | 25.11 | 1.32 | 27.37 | 27.77 |
| Previous gen | 69.23 | 3.79 | 102.98 | 106.20 | |
| An AJAX request | New gen | 16.92 | 0.26 | 17.55 | 19.40 |
| Previous gen | 49.17 | 6.84 | 84.82 | 94.19 |
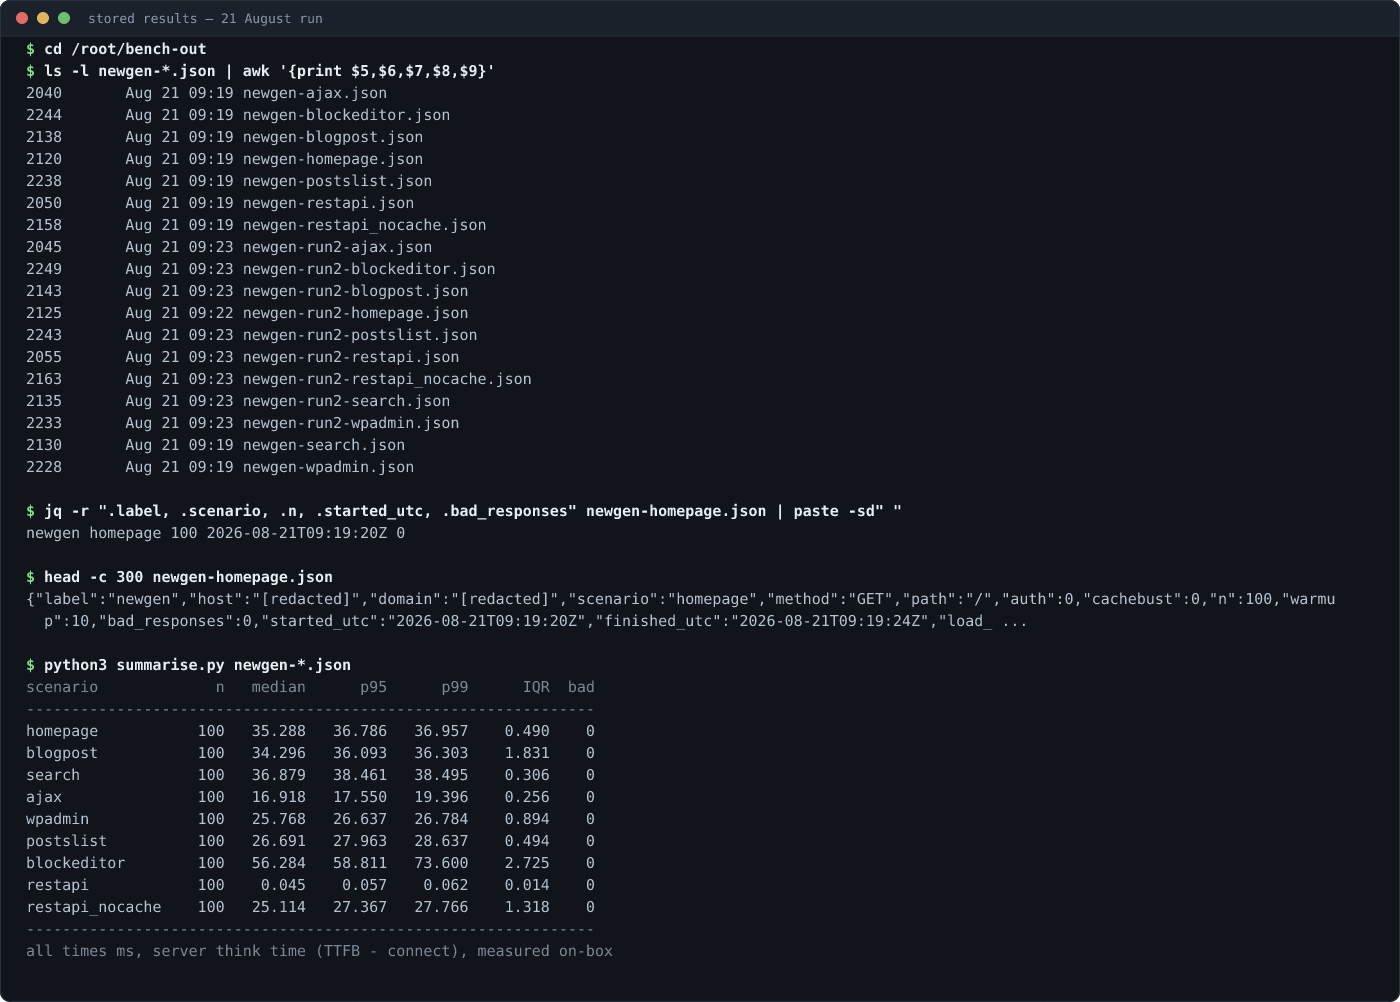
The block editor and wp-admin rows are the ones we care about most. They are what somebody building a site feels all day, and they are exactly what a page cache cannot fix, because an admin screen is built fresh every single time. Opening the block editor came in at 56 ms against 149 ms, a 93 ms saving on a single click that a site builder makes hundreds of times a day.
One honest wrinkle in that row: post-new.php writes an auto-draft row on every request, so it is partly a database write test, and the database configuration is the least matched thing between the two machines. Some of that gap is configuration rather than hardware. Both servers created an identical number of auto-drafts during the run and all of them were deleted afterwards.
The REST API row deserves a note too, because it corrects something we published earlier. Our nginx template puts a five-second microcache in front of /wp-json/ and nothing else, so a naive REST measurement compares two cache hits and tells you nothing about the server. Measured through the microcache the numbers are 0.04 ms and 0.23 ms, which are meaningless as a hardware comparison. The row in the table above bypasses the cache with a unique parameter per request, so every request is a genuine miss. That is the real number.
Consistency matters more than the average
The medians are the least interesting part of this dataset. The spread is the story.
The slowest requests, not just the typical one
The solid bar is the median request. The faded extension runs out to the 99th percentile, the slowest 1 request in 100. A short extension means almost every request behaves like the median one.
Opening the block editor
Loading the homepage
Running a site search
Loading a blog post
Opening the posts list
Opening wp-admin
The 99th percentile is reported descriptively. At n = 100, a confidence interval around a 99th percentile is not statistically valid, so we do not attach one.
On the new-generation server the homepage 99th percentile is 36.96 ms against a 35.29 ms median. That is a 1.7 ms tail: essentially every request is the median request. On the previous generation the same p99 is 144.22 ms against a 93.07 ms median, a 51 ms tail. The interquartile ranges say the same thing, 0.49 ms against 3.31 ms on the homepage and 0.26 ms against 6.84 ms on AJAX.
Predictability is worth more than a good average. An average is what a benchmark sees. A tail is what your visitor sees on the request that happens to land badly.
As for whether the apparatus itself is trustworthy: we ran the entire battery twice on both machines. Median drift between the two runs across all eighteen task-server pairs was 0.6 percent, and the worst drift on any real task was 3.3 percent. Against gaps of 160 to 190 percent, instrument noise is not what produced this result.
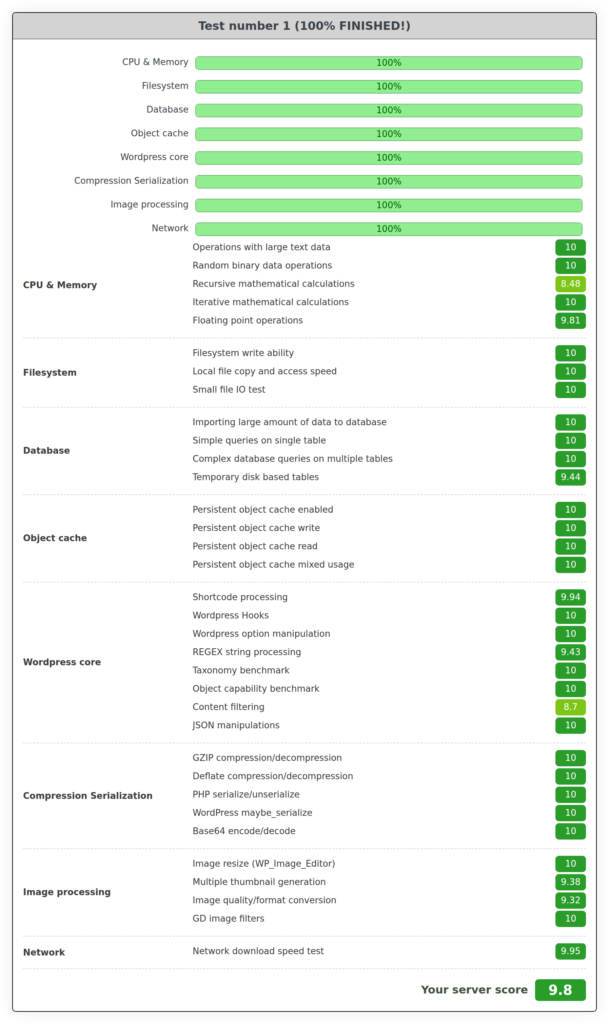
A benchmark we did not write: 9.8 against 7.3
Our own harness is our own harness. WP Benchmark is a free plugin from the WordPress repository that we did not write, and anyone can run it. We ran it on both machines on the same day with identical settings, alternating between them rather than batching.
Two notes on the cards below, because they are evidence and you should know exactly what they are. The plugin draws its results panel at a fixed 420 pixels with an 85 pixel label column, which makes the group labels overlap the rows beneath them, so we widened the panel and that column and captured at twice the pixel density to make the numbers legible. And the plugin stores only its most recent run, so the two object-cache-enabled cards are its own saved output while the two skipped-cache cards were regenerated from the per-test scores we recorded on the day, through the plugin’s own markup. We proved that template first by regenerating a card we still had and matching it byte for byte. No benchmark was re-run and no score was altered.
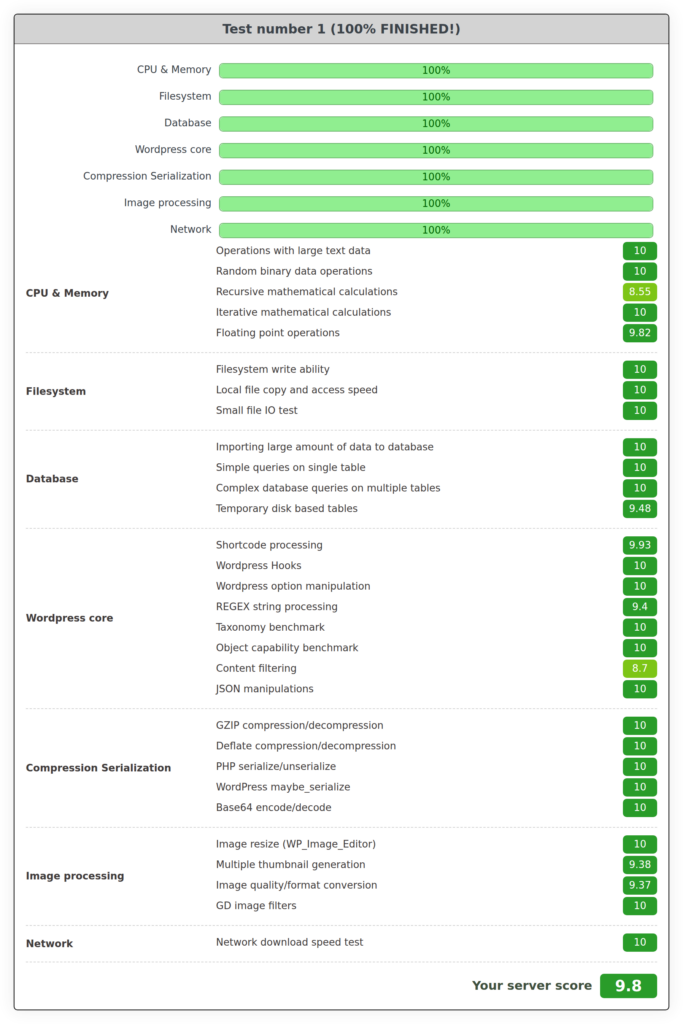
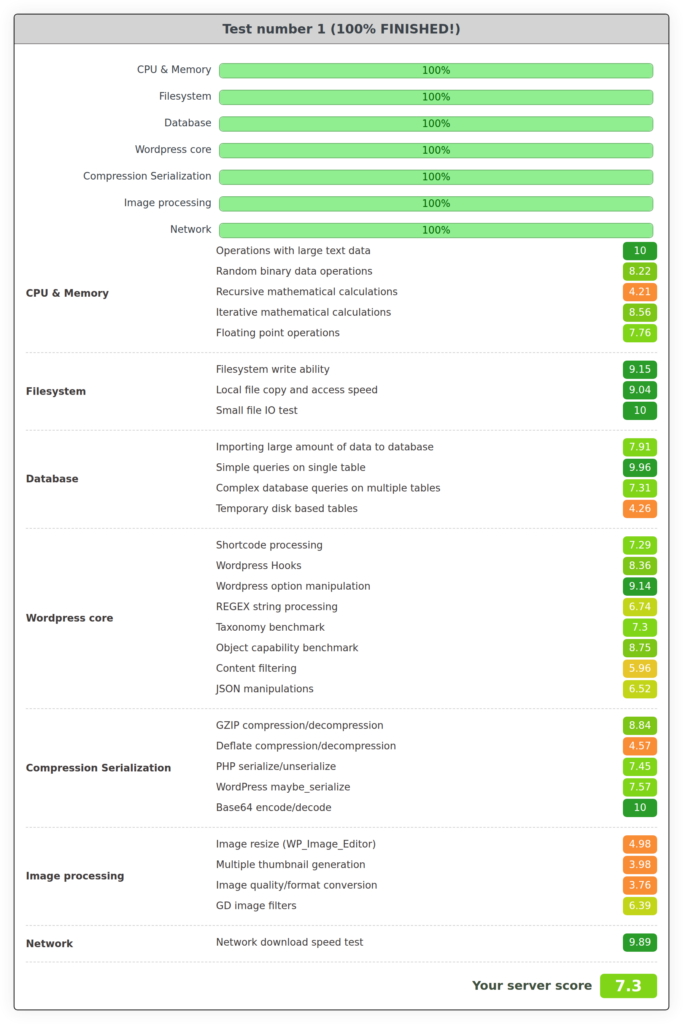
9.8 against 7.3, on a tool we do not control. The new-generation figure also reproduces the 9.7 we measured on 29 July, on a different day and a different site, which is a useful stability check on a number we had only ever recorded once.
Read that gap as a floor rather than a measurement. Nineteen of the thirty new-generation sub-tests sit at exactly 10.0, the top of the plugin’s scale, so wherever the new machine hits the ceiling the real difference is at least what the score implies and probably more. It also means these scores cannot be turned into speed multipliers. For multipliers, use the compute figures above, where the units are real.
Image processing is where the older machine struggles most: 3.76 to 4.98 across three of its four image sub-tests, against 9.37 to 10 on the new one. That is not an abstract workload. It is what happens every time somebody uploads a photo to the media library.
And since we are publishing the screenshot rather than describing it, the new-generation card is not flawless either. Content filtering 8.7, recursive mathematical calculations 8.55, image quality conversion 9.37, multiple thumbnail generation 9.38, REGEX processing 9.4.
One obvious objection: the July report had part of the benchmark switched off, so would a complete run have looked worse? We checked. With the persistent object cache tests enabled the new generation still scores 9.8, with all four object-cache sub-tests landing on 10. The previous generation scores 7.2 with them on, against 7.3 with them off.
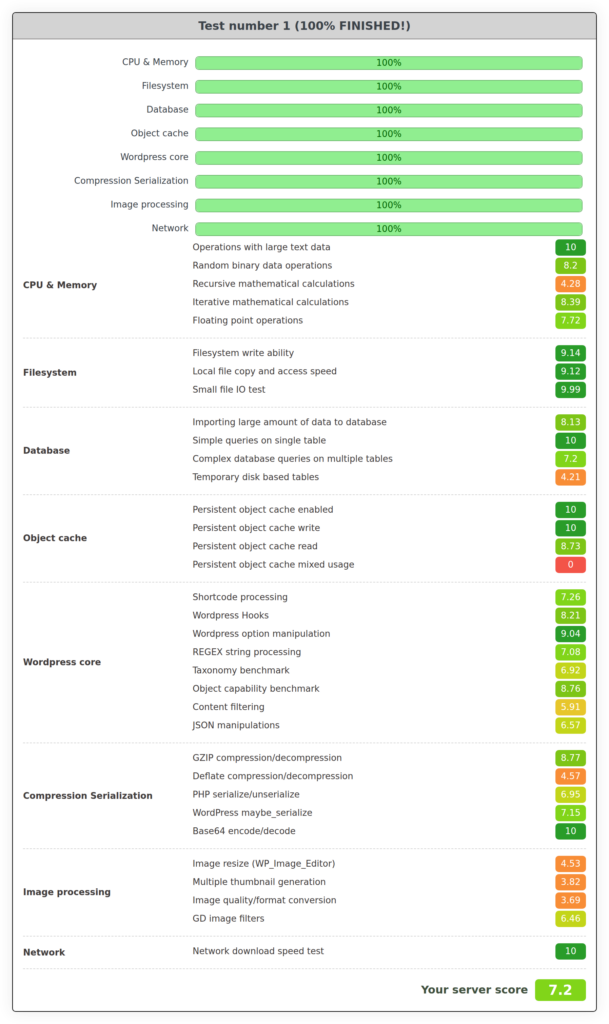
That last number needs a warning, and it cuts in a direction that does not flatter the comparison. On this plugin a test that blows its twenty-second ceiling is recorded as 0 ms and averaged in as though it had been instant, which pulls the average down and makes a struggling machine look faster. On the previous-generation box the object cache mixed-usage test timed out on all five iterations, and the read test on two of five. Its 7.2 is therefore flattered by those failures rather than penalised by them, and its object-cache sub-scores should not be read as a statement about object caching.
What else was different besides the hardware
This is the section most hosting benchmarks leave out, so here it is first rather than last. The two machines differ in more than their processors, and every one of those differences pushes the result in the same direction.
| What differs | New generation | Previous generation | Effect |
|---|---|---|---|
| Memory | 64 GB | 16 GB | 4× more headroom |
| Sites sharing the machine | 14 | 736 | 53× fewer neighbours |
| Machine type | Dedicated hardware | Virtual machine | No hypervisor overhead |
| Database buffer pool | 1.5 GB | 768 MB | 2× larger |
| Database log file | 2 GB | 256 MB | 8× larger |
| Memory pressure during the run | 3 MB of swap in use | 4.4 GB of swap in use | The older box was under real pressure |
| Storage | Local NVMe | Network block storage | Lower latency |
So read the table above as a comparison of two production environments as they actually run, which is the thing that affects a real customer, and not as a controlled comparison of two processors. We are not claiming the new CPU is two and a half times faster than the old one. We are saying a site on the new generation spends this much less time building a page than the same site on the generation it replaced, and here is every reason why beyond the silicon.
Two of those rows deserve to be said out loud. Our previous-generation servers carry far more sites each than the new ones, so part of this gap is neighbour load rather than hardware. And the previous-generation machine was 4.4 GB into swap during the test. That is a capacity decision we made, not a defect in the machine, and it is a fair description of what that generation is like to be hosted on today.
Nothing came out worse on the new generation, and that is itself worth flagging. A clean sweep with no counter-example anywhere in 1,800 paired samples is what you get when the comparison is not isolating one variable.
InstaWP infrastructure team, benchmark report, 21 August 2026
What we did not measure
- Concurrency. Every number here is a single request at a time. Our plans differ in PHP worker count rather than in raw speed, which means a bigger plan buys you headroom under simultaneous traffic rather than a faster single page. That is precisely the thing this dataset says nothing about. We have no spare machine to load test without putting live customer sites in the blast radius, so we are not publishing a concurrency number rather than publishing a bad one.
- Competitors. We have not benchmarked other hosts. Most host terms of service prohibit load testing anyway, so a head-to-head under load is not something we can lawfully produce. The established venue for that is Review Signal’s WordPress Hosting Benchmarks, which is independent and opt-in.
- What your visitor experiences. This is generation time on the server. A real page load also includes network distance, which is a point-of-presence question rather than a processor one, plus images, fonts and third-party scripts, and those can easily dwarf the numbers here.
- Client-side and CDN delivery. Not in this round. Anonymous HTML on our paid plans is edge-cached, so an external measurement mostly measures the CDN unless you go out of your way to prove the origin executed.
- A same-machine null test. Two identical sites on one box, measured as though they were different hosts, is the proper way to establish the noise floor of the apparatus. It is queued and not finished. Until it is, treat the run-to-run drift figure above as our best available estimate rather than a formal noise floor.
Where a faster server does not help
A faster machine shrinks the baseline. It does not fix a plugin doing something expensive. If your dashboard is slow, the cause is more often a heavy plugin, a bloated database or an external API call firing on every admin page than it is the hardware underneath. We went through the usual suspects in why is my WordPress site slow despite good hosting, and most of them are still true on the fastest machine we own.
Faster cores are also not a replacement for caching, they are the complement to it. Object cache spares WordPress the repeat database work, and faster cores speed up everything that still has to be built from scratch. For anonymous visitors a page cache does most of the work and we recommend it. For wp-admin, the editor, the cart and checkout, nothing is cached and the processor is what you feel. That is exactly why we lead on the admin numbers. If you want the caching side of this, we wrote up how object caching works on InstaWP and the difference between a CDN and a cache.
Run it yourself, and take our raw data
Two ways to check us. Install WP Benchmark from the WordPress repository and run it on your own site. It is the same tool that produced the report above and we have no control over what it says. If you would rather test on something disposable than on a live site, spin up a staging site first.
Wrapping up
A site on our new-generation servers builds an admin page in about a third of the time the previous generation took, and it does it far more consistently. Part of that is faster cores, part of it is more memory, and part of it is fewer neighbours. We have shown you which is which as far as we can measure it, and we have told you what we have not measured yet.
The rollout is regional and still in progress, so not every site is on the new generation yet and we are not going to promise you a date. If you want to see what it feels like, the plans are on our managed WordPress hosting page and billing is pay as you go. If your workload does not fit a standard plan, we build to order up to 96 cores with memory and NVMe sized to match, and you can talk to us about it.
For the wider picture of what runs underneath a site here, our cloud stack breakdown covers the rest of the layers. And if you are moving a site over to see the difference for yourself, staging to production walks through the safe way to do it.