WP Engine site monitoring is a paid add-on, not something bundled into your hosting plan. It pings your production site every five minutes and alerts you by email or Slack after two consecutive failed checks, so an outage is confirmed roughly ten minutes after it starts. It watches production environments only. This guide covers what the add-on actually does, what WP Engine’s 99.95% uptime guarantee is worth in minutes, why code-level performance monitoring is locked to Premium plans, and how four other managed WordPress hosts price the same job.
Key takeaways
- Site Monitoring is an add-on. It is bought from the Modify Plan page in the User Portal, and WP Engine does not publish its price on the plans page.
- Five-minute checks, ten-minute confirmation. Two consecutive failures are needed before an outage is declared.
- Production only. Staging and development environments are not monitored, and each multisite URL needs its own licence.
- The uptime guarantee is 99.95%, which permits about 21 minutes of downtime a month. The 99.99% figure belongs to the Enhanced SLA, not the standard one.
- APM is Premium-only. New Relic APM Pro cannot be purchased on Lite, Startup, Professional, Growth or Scale.
- Every host here monitors only its own sites, except one. InstaWP connects over a plugin rather than a hosting account, so it watches client sites wherever they are, from $2 per site per month.
What WP Engine Site Monitoring Actually Includes
Site Monitoring is a product extension you add to an existing WP Engine hosting plan from the Modify Plan page in the User Portal. Once enabled, WP Engine requests your production URL on a fixed schedule and records the response code. Anything in the 2xx or 3xx range counts as reachable. A 401, 403, 404, 500, 502, 503 or 504 counts as a failure.
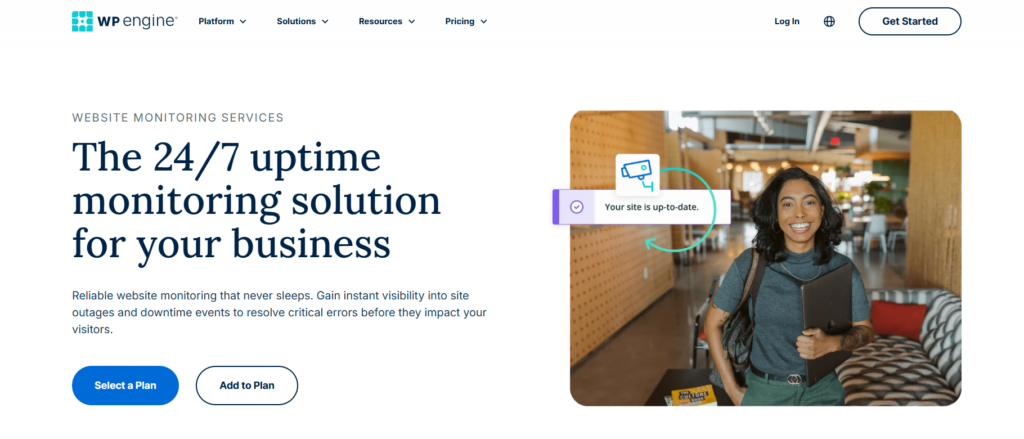
The full specification, from WP Engine’s own Site Monitoring documentation:
| Check frequency | Every five minutes |
| Outage threshold | Two consecutive failed checks, so about ten minutes before an alert fires |
| Environments covered | Production only. Staging and development are not monitored |
| Counted as up | Any 2xx or 3xx response, for example 200 or 301 |
| Counted as down | 401, 403, 404, 500, 502, 503, 504 |
| Alert channels | Email and Slack, with email routed to Full or Owner roles |
| Recovery alerts | Yes, a second notification is sent when the outage clears |
| Also surfaced | SSL expiry warnings, average response time, and a link to that site’s access logs |
| Multisite | Each URL needs its own licence |
| How you buy it | Paid product extension, added from the Modify Plan page |
How WP Engine detects an outage
The two-failure rule matters more than the five-minute interval, and it is the number most comparison posts leave out. A single failed ping does nothing. WP Engine waits for a second failure five minutes later before it declares an outage and sends the alert. A blip that resolves inside five minutes is invisible to you, which is usually the right call, because a one-off timeout during a deploy is noise rather than an incident.
The practical consequence is that your realistic time to first notification is around ten minutes, plus however long it takes someone to read the alert. For a brochure site that is fine. For a WooCommerce store on a Friday evening it is ten minutes of failed checkouts before anyone knows.
WP Engine’s dashboard also distinguishes states that are not really outages. A grey clock means Smart Plugin Manager is mid-update. A 200 response with a warning symbol means the site is up but its SSL certificate has expired, which is the kind of failure that costs you traffic without ever showing as downtime.
What Site Monitoring does not do
It is an availability check rather than a health check. A plugin update can break your checkout while the homepage keeps returning 200, and Site Monitoring will report everything as fine. It has nothing to say about a page that takes nine seconds to load, it does not scan for vulnerabilities, and it ignores your staging environment, which is where most agencies actually break things. Any of that is a second product.
The distinction matters because “monitoring” gets used loosely across the hosting market. Our guide to monitoring WordPress breaks the category into its four separate jobs, and most hosts only do one or two of them.
WP Engine Uptime and the WP Engine Uptime Guarantee
WP Engine’s standard uptime guarantee is 99.95% monthly service availability. The 99.99% figure that circulates in reviews belongs to the Enhanced SLA, which is a separate commercial arrangement rather than the default on a shared plan. Both are set out in the WP Engine Service Level Agreement.
Availability is calculated as the total minutes the service was available, multiplied by 100, divided by the total minutes in the month minus excused downtime. That subtraction is where most of the argument lives.
What 99.95% allows in practice
A 30-day month contains 43,200 minutes, which makes the percentages easier to read as time. This is what each common guarantee permits before a host owes you anything.
| Guarantee | Downtime allowed per 30-day month | Downtime allowed per year |
|---|---|---|
| 99.9% | About 43 minutes | About 8 hours 45 minutes |
| 99.95% | About 21 minutes | About 4 hours 23 minutes |
| 99.99% | About 4 minutes | About 53 minutes |
Note the interaction with the monitoring add-on. WP Engine needs about ten minutes to confirm an outage, and its standard guarantee allows about 21 minutes a month. So roughly half of a fully compliant month’s downtime allowance can elapse before the alert reaches your inbox.
How WP Engine SLA credits work
Credits are not automatic. You have to notice the downtime, and you have to ask.
- Standard SLA: 5% of the applicable monthly fees for each full hour of downtime beyond the availability target. One to 60 minutes over is a 5% credit, 61 to 120 minutes over is 10%, and so on.
- Enhanced SLA: 3% of the applicable monthly fees for each half hour beyond the target, which accrues faster.
- Ceiling: credits cannot exceed 100% of that month’s fees.
- Claim window: you must contact Support within 30 days of the event. Credits do not carry over, cannot be aggregated, are not refunded in cash, and expire when the agreement ends.
Excused downtime is excluded from the calculation entirely. That covers scheduled maintenance in the published regional windows, emergency maintenance for security or integrity reasons, beta services, force majeure, and downtime caused by your own actions, unauthorised use, or exceeding stated limits. A plugin you deployed that took the site down is your downtime, not theirs.
Worth knowing: an SLA credit pays back a slice of the hosting fee, never the revenue lost during the outage. On a $30 plan, a 5% credit is worth $1.50. The guarantee tells you how seriously a host takes availability. It does not protect the client whose store was down, which is why the monitoring is the part you actually need.
If you want the wider version of this, including how to set alert thresholds your team will actually act on, our website uptime monitoring guide for agencies covers the operational side.
WP Engine APM and Performance Analytics
WP Engine’s application performance monitoring product is called Application Performance, and it is available on Premium plans only. It cannot be purchased on the shared plans at all, which means Lite, Startup, Professional, Growth and Scale customers have no route to it regardless of budget. Premium customers buy it by speaking to their Account Manager or the sales team. For eCommerce plans it is included from Growth upward.
Agencies get caught out by this regularly, because Site Monitoring and Application Performance sound like two halves of one product. They are separate purchases, sold on different plan tiers, and they answer different questions.
What Application Performance shows you
Underneath, it is New Relic APM Pro, resold with WordPress-specific support from WP Engine. You get read-only access to the New Relic account collecting your data, and the instrumentation gives you:
- Transaction traces, so you can see which template or endpoint is slow rather than just that the page is slow.
- Query-level database visibility, which is how you find the one uncached meta_query dragging an archive page.
- Apdex scoring, a satisfaction threshold that turns raw response times into a single number you can trend.
- External call timing, so a slow third-party API stops looking like a slow site.
- Error analytics across the application rather than a single request.
That is genuinely good tooling. The question is whether the plan tier that unlocks it matches the sites you run.
What to use if you are on a shared WP Engine plan
If you are on Startup through Scale, code-level APM is off the table with WP Engine. Your options are to instrument the site yourself with a New Relic account you own, to use Query Monitor and a profiler during development, or to run lab-based performance scans on a schedule and watch the trend. None of those give you continuous production tracing, and you should be honest with clients about that gap rather than implying you have it.
Quick answer: does WP Engine include APM?
No, not on any shared plan. Application Performance is a Premium-plan product extension built on New Relic APM Pro, and WP Engine states it cannot be purchased for shared plans. eCommerce plans include it from Growth upward.
What WP Engine Site Monitoring Costs
WP Engine does not publish a price for the Site Monitoring add-on. It is quoted inside the User Portal on the Modify Plan page, which means you cannot budget for it before you are a customer. What is published is the hosting underneath it, from WP Engine’s plans page:
| Plan | From | Sites | Visits per month | APM available? |
|---|---|---|---|---|
| Startup | $30/mo | 1 | 25,000 | No |
| Professional | $55/mo | 3 | 75,000 | No |
| Growth | $109/mo | 10 | 100,000 | No |
| Scale | $276/mo | 30 | 400,000 | No |
| Premium | Quoted by sales | Custom | Custom | Yes, as a paid extension |
For an agency, the plan boundary usually costs more than the sticker price does. Ten client sites puts you on Growth at $109 a month before monitoring. Cross into 11 sites and you are pricing Scale. If most of those sites are low-traffic brochure sites for local businesses, you are paying enterprise-shaped prices for a workload that does not need them, and you still have to add monitoring on top.
Which Managed WordPress Hosts Include Monitoring?
Most comparison posts stop at WP Engine versus one alternative. If you are choosing partly on monitoring, the useful view is the market, and the first thing it shows is a split. Four of the five hosts below monitor their own customers and nobody else’s. InstaWP is the exception, because it connects to a site through a plugin rather than through a hosting account, so it watches client sites wherever they already live. That is why it sits at the top of the table rather than the bottom.
Every cell was read from that company’s own documentation or legal pages on 26 August 2026. Where a cell says “not published”, the figure was not stated on that host’s own site when we checked, which is not the same as the capability being absent.
| Host | Watches sites hosted elsewhere | Uptime monitoring | Code-level APM | Published uptime guarantee |
|---|---|---|---|---|
| InstaWP | Yes, through the InstaWP Connect plugin | $2 per site per month, free from Plus. Uptime and SSL monitoring: multi-region checks, response-time history, email and Slack alerts | Performance scanner reporting Core Web Vitals on demand, not continuous tracing | Does not publish an uptime percentage |
| WP Engine | No | Paid add-on. Five-minute checks, production environments only | New Relic APM Pro, Premium plans only. Not sold on Lite, Startup, Professional, Growth or Scale | 99.95%, or 99.99% on the Enhanced SLA |
| Kinsta | No | Free on all plans. Checks every three minutes, email after three consecutive failures | Kinsta APM, free on all plans, in the MyKinsta dashboard | 99.9%, higher only if set in the order form |
| Pantheon | No | Synthetic checks through the bundled New Relic account, 10,000 per month | New Relic APM Pro, free on most plans. Not available on a live Basic plan | 99.99% with the Multizone Failover add-on, on Elite plans except Elite Starter |
| Nexcess (Liquid Web) | No | Server-level monitoring described in the SLA | Not published as an included product | 100%, but scoped to network transit and electricity rather than site availability |
The SLAs are not measuring the same thing
Line up four uptime guarantees and it looks like a league table. It is not, because the hosts are not measuring the same event.
WP Engine and Kinsta both define availability in terms of your service being reachable, then subtract excused downtime. Pantheon’s headline 99.99% is attached to a specific add-on, Multizone Failover, which is only sold on Elite plans other than Elite Starter, so quoting it as Pantheon’s general guarantee overstates what a mid-tier customer gets. Nexcess is the sharpest example: the Liquid Web SLA guarantees 100% uninterrupted transit to the internet and 100% uninterrupted electricity, and it defines Loss of Services as the customer being unable to connect to the Nexcess datacenter. That is a datacenter guarantee, not a promise that your WordPress site returns a 200.
So a 100% guarantee can cover less of what you care about than a 99.95% one. Read the definition of downtime before you read the percentage. It is also worth saying plainly that InstaWP publishes no uptime percentage at all, which is the honest position when you have no fleet-wide measurement to stand behind. If a contractual availability number is a procurement requirement, WP Engine or Pantheon will serve you better on that specific axis.
Which host offers better site monitoring than WP Engine?
If you only compare uptime frequency inside a hosting account, WP Engine has capable competition. But agencies rarely manage a perfectly uniform hosting stack. Client sites end up spread across different hosts, inherited accounts, old infrastructure, and platforms you did not choose.
That is where InstaWP’s WordPress site management takes a different approach. Instead of limiting monitoring to sites hosted on the same infrastructure, this managed hosting provider lets you bring InstaWP-hosted and externally hosted WordPress sites into one management dashboard. An existing WordPress site can be connected through the InstaWP Connect plugin, so agencies can monitor and manage sites without migrating every client onto the same host first.
That distinction matters once you manage 10, 50, or 200 client sites. A hosting monitor tells you what is happening on that host. InstaWP gives you a portfolio-level view of which WordPress site needs attention and what you can do about it next.
Monitor uptime from multiple global locations
If you’re on any of the managed hosting plan of InstaWP, you can check uptime every minute from 20 global locations, covering North America, Europe, Asia Pacific, Africa, the Middle East, and South America.
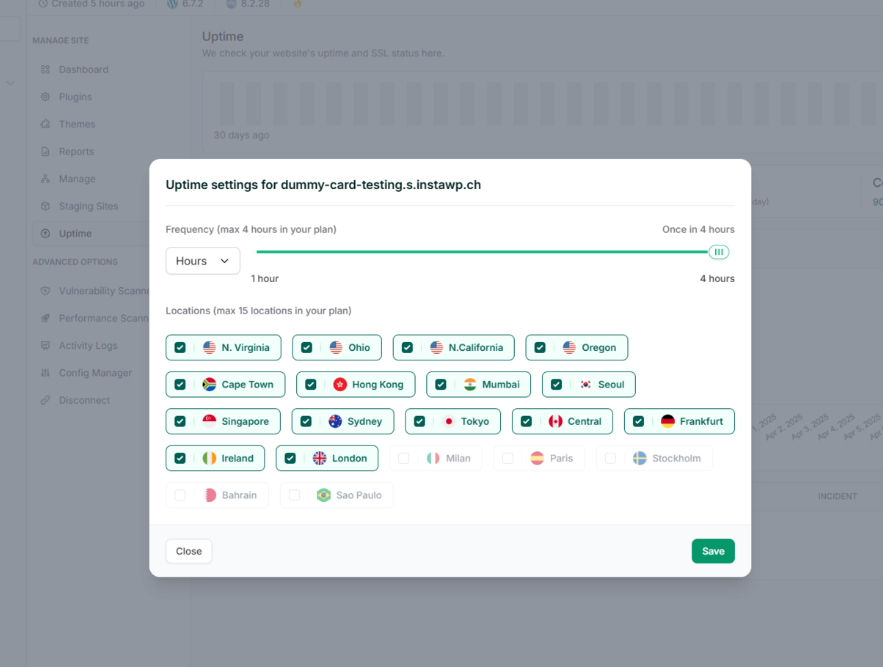
Inside the Uptime dashboard, you can track:
- Current uptime status
- Uptime percentage over the previous 30 days
- Response time and average response time
- Response-time history
- SSL certificate expiry
- Monitoring locations
- Monitoring frequency
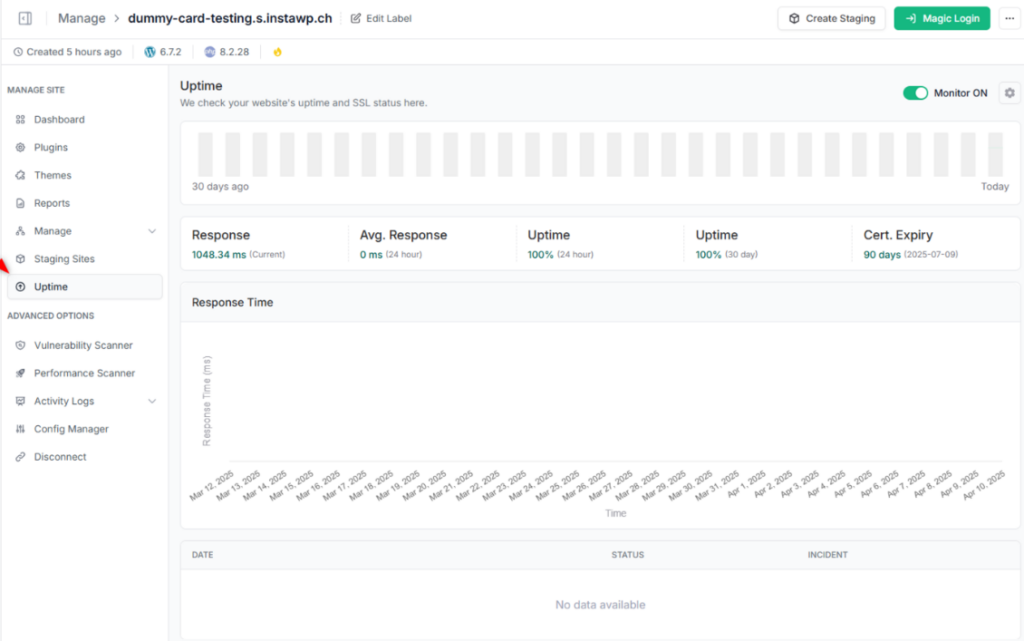
That gives agencies more context than a simple green/red availability indicator. If a site remains online but response times start climbing, you have a signal to investigate before the problem becomes a full outage.
See the InstaWP uptime and performance monitoring documentation for the complete monitoring workflow.
Track performance before clients report a slow site
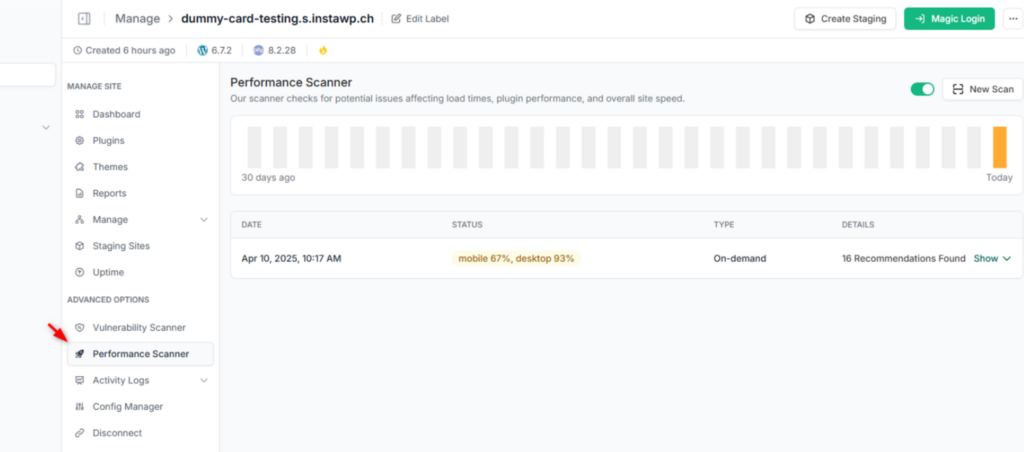
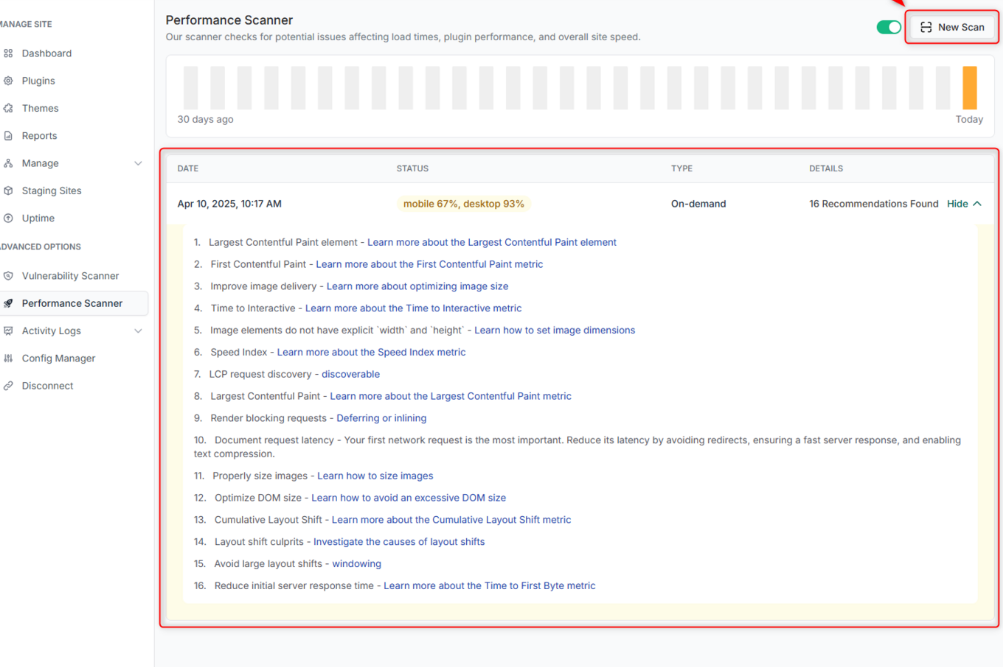
Availability is only one part of WordPress health. InstaWP’s managed hosting also includes a Performance Scanner, letting you run performance scans manually or automate them for managed sites. The management dashboard records the latest performance check alongside other site-health information, so slow sites are easier to identify across a client portfolio.
For sites hosted directly on InstaWP, developers can go deeper with real-time server monitoring. The Monitor panel exposes live metrics such as:
- Active PHP workers
- RAM consumption
- CPU usage
- Database connections
- Active MySQL processes and queries
That becomes particularly useful when you are debugging a resource-heavy plugin, investigating a traffic spike, running load tests, or trying to understand why a WordPress site slows down under concurrency. Instead of seeing only that a page is slow, you can get closer to why it is slow.
Find vulnerable WordPress sites across the fleet
Site monitoring also needs a security layer. InstaWP’s WordPress site management includes a vulnerability scanner for WordPress core, installed plugins, and themes. Automatic vulnerability scanning is available for managed sites, helping agencies spot known vulnerabilities without manually checking every WordPress installation.
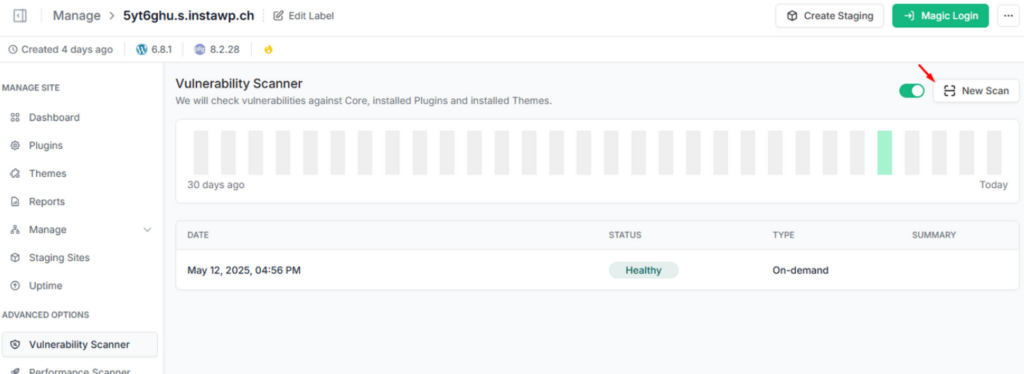
The important part is the fleet view. If you manage dozens of sites, you do not want to open 40 WordPress dashboards just to discover which clients are running an affected plugin. InstaWP’s managed hosting surfaces vulnerabilities alongside uptime, update status, and other site information so you can identify the sites that need intervention first.
That turns vulnerability monitoring into an operational workflow rather than another report you have to check separately.
See what changed when something goes wrong
A monitoring alert tells you that something happened. Activity logs help answer what changed before it happened.
InstaWP’s managed hosting also include Activity Log to provide visibility into site activity. Custom alert rules can be configured for important actions such as plugin changes, new users, or security-related events.
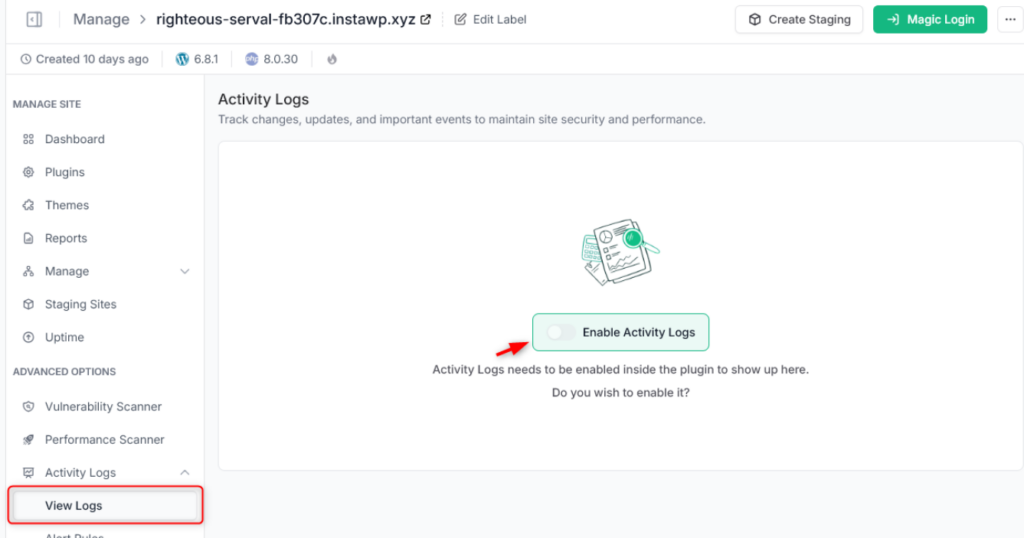
That becomes valuable during troubleshooting. If a client’s site suddenly starts behaving differently after a maintenance window, you can correlate the issue with recent WordPress activity instead of reconstructing the timeline from memory.
For InstaWP-hosted sites, developers can also access WordPress and server logs, including error, access, command, and debug logs.
So the workflow moves from:
“The site has a problem.”
to:
“The site has a problem → here is what changed → here are the logs → now fix it.”
Monitoring is connected directly to remediation
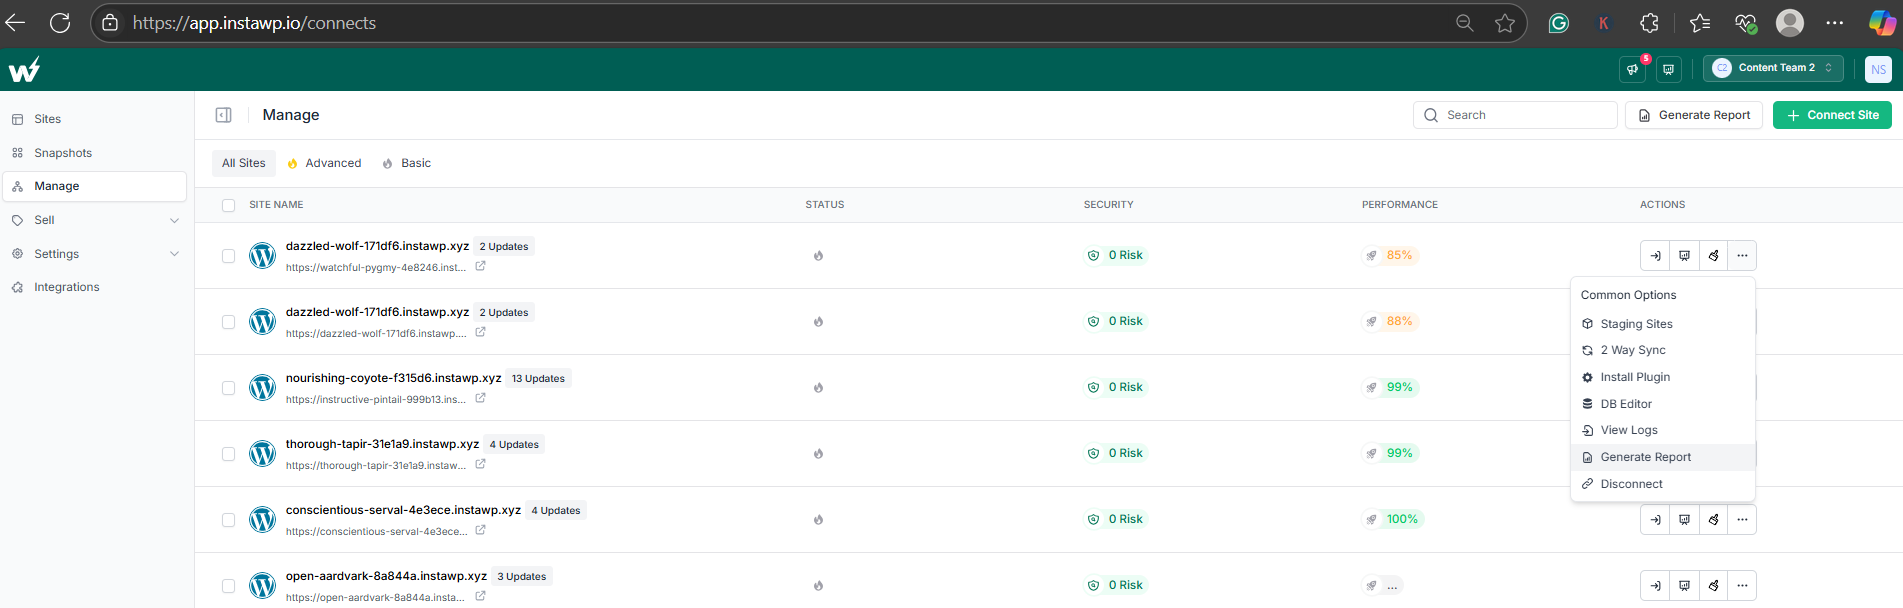
This is where InstaWP becomes more useful than a standalone monitoring tool. The same site management dashboard that shows uptime, vulnerabilities, updates, and site status also gives you tools to act on those findings. You can:
- Update plugins and themes across multiple sites
- Schedule WordPress maintenance updates
- Activate or deactivate plugins remotely
- Purge cache
- Manage users
- Access a site through Magic Login
- Review activity logs
- Run vulnerability and performance scans
- Create a WordPress staging site before making a risky change
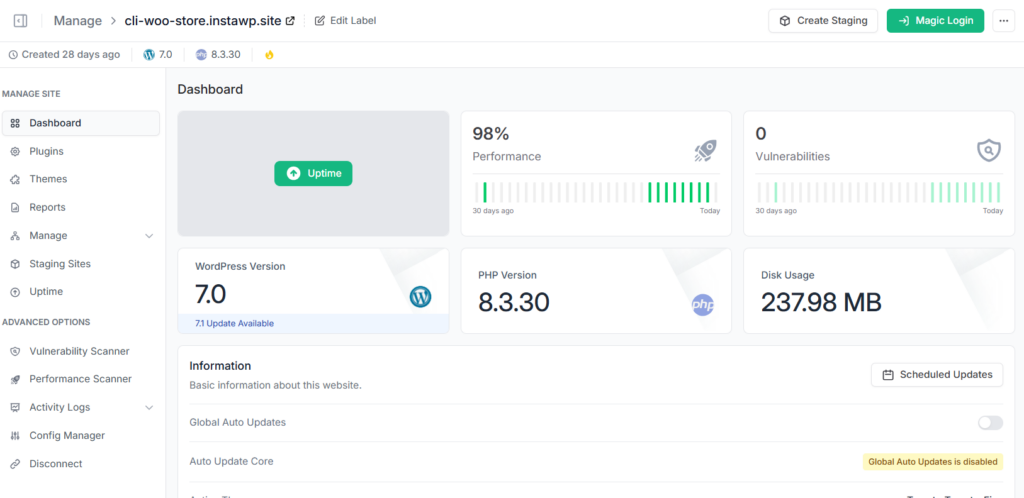
For agencies, that shortens the distance between detection and resolution. Suppose monitoring flags a client site and you discover an outdated plugin with a known vulnerability. Instead of opening the hosting panel, finding WordPress credentials, logging into wp-admin, creating a manual staging copy, and then performing the update, much of that workflow can stay inside InstaWP.
For larger portfolios, you can also perform bulk WordPress updates across selected sites instead of repeating the same maintenance task site by site.
Monitoring that turns into maintenance work
An alert is only useful if you can act on it in the same place. Because monitoring sits inside site management rather than beside it, the fix is one screen away from the finding. You can update plugins, themes and WordPress core across the whole fleet in one pass, or push bulk and selective updates on a schedule you choose, and log in to any connected site in one click without hunting for credentials. There is staging alongside it, so you can verify an update on a copy before it reaches a live client store.
White-label PDF reports are the part agencies tend to underrate. A retainer that quietly prevents problems is the hardest kind to justify at renewal, and a monthly report is what makes the work visible.
So, is InstaWP better than WP Engine for site monitoring?
For a single website already hosted on WP Engine, WP Engine’s native monitoring may be enough. For an agency managing WordPress sites across different hosts, InstaWP solves a broader problem.
It combines:
Uptime monitoring → Performance monitoring → Vulnerability scanning → Activity visibility → Updates → Troubleshooting → Staging
inside the same WordPress management platform.
That means you are not simply paying to learn that a client site went down. You are building a workflow that helps your team detect the issue, understand it, test the fix, and act on it from the same place.
For an agency managing a mixed WordPress portfolio, that is the more meaningful comparison.
What monitoring costs, and what you have to buy to get it
On four of these five hosts, the monitoring is the cheap part. The real cost is the hosting you have to move every client site onto before you can use it.
| Host | What the monitoring costs | What you must buy first |
|---|---|---|
| InstaWP | $2 per site per month, or included free from the Plus tier at $9/mo | Nothing. The site stays where it is |
| WP Engine | Not published. Quoted in the User Portal | A WP Engine plan, from $30/mo, plus the add-on on top |
| Kinsta | Free on all plans | Kinsta hosting, and a migration for every client site |
| Pantheon | Bundled into the New Relic account on most plans | Pantheon hosting, and a migration for every client site |
| Nexcess (Liquid Web) | Server-level, included with the plan | Nexcess hosting, and a migration for every client site |
Put ten client sites through that. Monitoring them on InstaWP without moving anything is $20 a month, and if you also host them on InstaWP from the Plus tier upward the monitoring stops being a line item at all. Reaching the same coverage on WP Engine means hosting all ten there first, which is the Growth plan at $109 a month, and then adding a monitoring extension whose price you cannot see until you are inside the portal.
Hosting on InstaWP is priced the same way, per site and billed daily, from $5 a month on Starter to $45 on Elite, with $2 sandboxes for staging and client builds. There is no plan boundary that triples your bill because you signed an eleventh client, and you can park a finished site as a $2 sandbox rather than paying a production rate for something nobody visits. The current numbers are on the InstaWP pricing page, and the wider platform picture is in our workflows overview and on the managed WordPress hosting page.
Watching client sites on four different hosts?
Connect them to one dashboard and get uptime, SSL, vulnerability and update status in a single view, wherever each site is hosted. No migration required.
The Verdict
WP Engine Site Monitoring does what it says. Five-minute checks, sensible outage confirmation, email and Slack alerts, SSL warnings, and a link straight to the access logs when something breaks. If your whole estate is on WP Engine, it is a reasonable add-on and the log integration is the part you will actually appreciate at 2am.
What it is not is a complete monitoring story. It only sees production, it only sees WP Engine sites, and the code-level view that tells you why a page got slow is gated behind Premium. Kinsta and Pantheon both include more of that stack at lower tiers, which is worth knowing before you renew.
And if your client sites are not all in one place, none of those three can help you, because they only watch what they host. That is the gap InstaWP is built for: connect a site over a plugin, watch uptime, SSL, performance and vulnerabilities from one dashboard for $2 a month per site, and move a site onto managed WordPress hosting only when there is a reason to, not because your monitoring demanded it.
Frequently Asked Questions
Does WP Engine include site monitoring on every plan?
No. Site Monitoring is a paid product extension you add from the Modify Plan page in the WP Engine User Portal. It is not bundled into the shared hosting plans, and it monitors production environments only.
What is WP Engine uptime guarantee?
WP Engine guarantees 99.95% monthly service availability under its standard SLA, which permits about 21 minutes of downtime in a 30-day month. A 99.99% target is available under the Enhanced SLA. Credits are 5% of monthly fees per full hour beyond the target on the standard SLA, or 3% per half hour on the Enhanced SLA, capped at 100% of that month’s fees, and you must claim within 30 days.
How often does WP Engine check if my site is down?
Every five minutes. An outage is only declared after two consecutive failed checks, so the practical time to your first alert is around ten minutes. Any 2xx or 3xx response counts as up, while 401, 403, 404, 500, 502, 503 and 504 count as failures.
Does WP Engine include application performance monitoring?
Only on Premium plans. WP Engine Application Performance is New Relic APM Pro resold with WordPress support, and WP Engine states it cannot be purchased for shared plans, which covers Lite, Startup, Professional, Growth and Scale. eCommerce plans include it from Growth upward.
Can WP Engine monitor a site hosted somewhere else?
No. WP Engine Site Monitoring only covers production environments on WP Engine hosting. If your client sites are spread across several hosts you need a host-independent tool, such as InstaWP site management, which connects to any WordPress site through a plugin regardless of who hosts it.
Which host offers better site monitoring than WP Engine?
On availability alone, Kinsta: three-minute checks and a free APM tool on every plan, against WP Engine’s five-minute checks sold as an add-on and APM restricted to Premium. But both only watch sites they host. For an agency with client sites across several hosts, InstaWP is the practical answer, because it connects over a plugin rather than a hosting account and covers uptime, SSL, performance and vulnerabilities on any WordPress site from $2 per site per month.
How much does InstaWP site monitoring cost?
Site management, which includes uptime and SSL monitoring, logs and update automation, is $2 per site per month, and it is included at no extra cost on Plus hosting plans and above. Hosting is priced separately per site and billed daily, from $5 a month on Starter to $45 on Elite, with $2 sandboxes for staging. You do not need InstaWP hosting to monitor a site.
Where do I check WP Engine system status during an outage?
WP Engine publishes a public status page at wpenginestatus.com for platform-wide incidents, and the Site Monitoring dashboard shows the status of your own environments with a link to that site’s access logs. Check both: a platform incident and a fault in your own code look identical from the outside, and the logs are what tell them apart.